Zabbix vs Prometheus
开源监控系统有很多,但是一般来说,国内流行的就两种:
- zabbix
- prometheus
这两者的监控范围都是围绕 指标 做监控(现在prometheus也有关于日志、链路的方案,但是没什么人用)
# 1、Zabbix
一个大而全的 monolithic 应用,集成了数据采集、存储、告警、可视化于一身。对传统IT设施(网络设备、VM、数据库)的监控支持非常好。
zabbix 应该很多开发者都会听说过。
注意我说的是 传统IT设施。类似于服务器的CPU、内存、磁盘 等等。
它也可以监控服务,例如 Java(通过Java程序开启JMX,监控JVM如堆内存、GC 等等)
不过在我看来,Zabbix 不如 Prometheus ,Prometheus 包含了所有 Zabbix 的功能,同时它更简单、功能更强大。
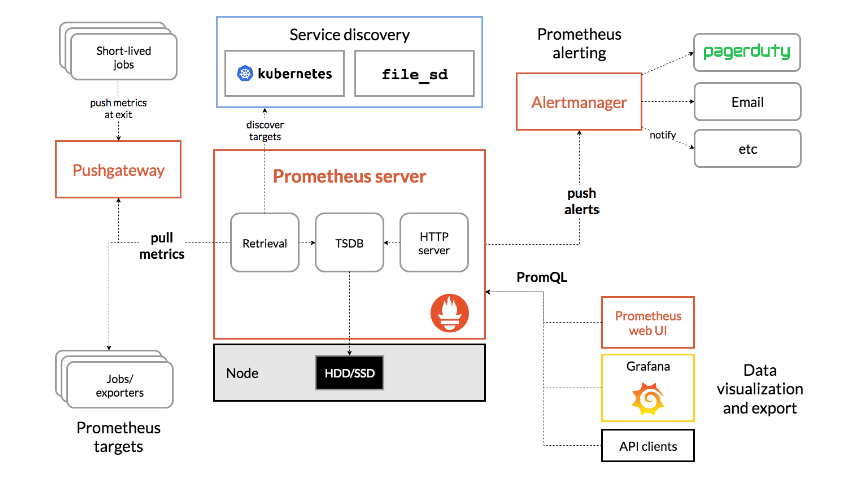
# 2、Prometheus
微服务以及云原生的趋势下,prometheus (opens new window) 应运而生。
Prometheus 专为云原生世界而设计,可与 Kubernetes 以及其他云和容器管理器集成,持续发现和监服务。
Prometheus是一个开源系统监控和警报工具包,它太丰富了,既可以收集、存储、查询 指标,又可以做告警、仪表板。
Prometheus 的查询语言十分强大,但是其数据格式还是 Prometheus 自己定义的。因此,它只能与 Prometheus 服务器集成,不能与其他系统集成。
# Prometheus 指标类型
Prometheus 定义了 4 种不同的指标类型:
- Counter(计数器)
- Gauge(仪表盘)
- Histogram(直方图)
- Summary(汇总)
# prometheus 文本格式(协议)
# HELP http_requests_total The total number of HTTP requests.
# TYPE http_requests_total counter
http_requests_total{method="post",code="200"} 1027 1395066363000
http_requests_total{method="post",code="400"}    3 1395066363000

# Minimalistic line:
metric_without_timestamp_and_labels 12.47

# A weird metric from before the epoch:
something_weird{problem="division by zero"} +Inf -3982045

# A histogram, which has a pretty complex representation in the text format:
# HELP http_request_duration_seconds A histogram of the request duration.
# TYPE http_request_duration_seconds histogram
http_request_duration_seconds_bucket{le="0.05"} 24054
http_request_duration_seconds_bucket{le="0.1"} 33444
http_request_duration_seconds_bucket{le="0.2"} 100392
http_request_duration_seconds_bucket{le="0.5"} 129389
http_request_duration_seconds_bucket{le="1"} 133988
http_request_duration_seconds_bucket{le="+Inf"} 144320
http_request_duration_seconds_sum 53423
http_request_duration_seconds_count{app="demo"} 144320
http_request_duration_seconds_count{app="demo"} 144320 为例:
http_request_duration_seconds_count -- 指标名称
{app="demo"} -- 标签,k=v形式,用于丰富指标的描述
144320 值
合起来的含义就是: http 请求次数,从程序运行以来累计记录值就是 144320 次
这些简单的数据类型,使用PromQL(一种 利用此维度的灵活查询语言 )对开发人员来说,十分简单。
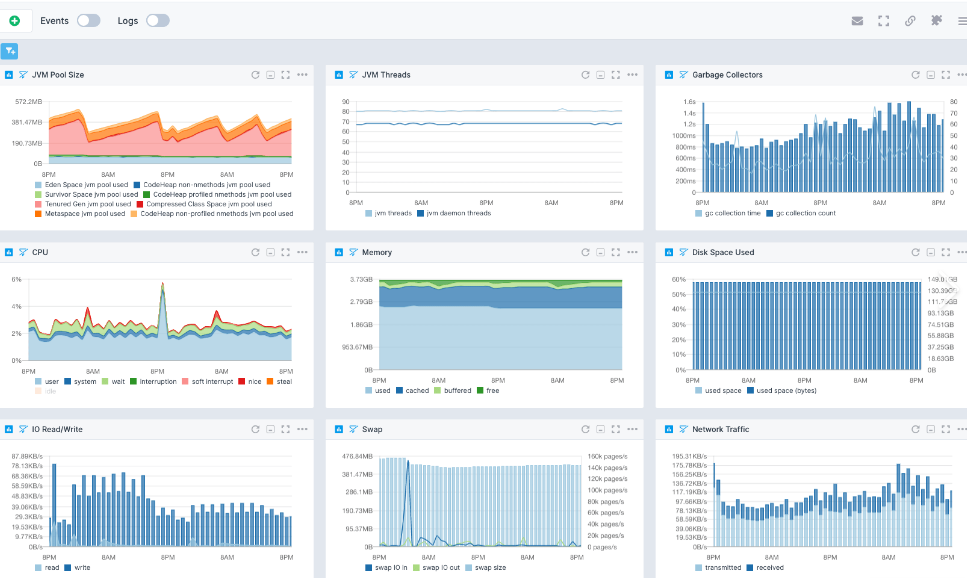
同时还有开源 exporter 的配合(暴露prometheus格式指标) + grafana(展示), 可以做成更多自定义图表:

在可观测建设能力的上来说,选择 prometheus ,可以说是最快速,最简单的方案了。